Yes, yes the stock market. Does it matter water is being sucked out of the land and dumped into rising seas? What about emissions as we industrialize the ocean? Will growing conflict slow heat or speed it up? We have 3 guests to answer those questions: Luis Samaniego in Potsdam, David Kroodsma in Oakland, and Manfred Lenzen in Sydney.

Listen to or download this Radio Ecoshock show in CD Quality (57 MB) or Lo-Fi (14 MB)
SOILS ARE DRYING, LOSING WATER TO THE SEA
LUIS SAMANIEGO
About 10 years ago, NASA scientists Jay Famiglietti told us groundwater under California was being depleted. Satellites measured the loss, via a change in gravity. Is a grand transfer of water moving into the sea? Is that happening all over the world? Brilliant new science says “Yes”. Think about what that means for agriculture, for Nature, and sea level rise.
A team of scientists just measured water loss from world soils using the American Grace twin gravity satellites. The amount of water going from land to sea is so large it changes Earth on it’s axis. In some years, land water loss has contributed more to sea level rise than melt from the Greenland ice sheets.
This is big stuff, bigger than human affairs. It needs to be checked by different observations, and we need to rule out just a temporary trend. The new team, led by Korea’s Ki-Weon Seo, worked out land water loss – even for decades before the satellites. They had to combine almost unrelated fields of scientific discovery. The techniques used are solid, but so different that even top scientists struggle to explain the whole process.
We managed to reach one of the premier people in groundwater science, Luis Samaniego. But even he says this is hard to grasp. A person would need expertise in satellites, measuring buoys in oceanography, a bit of Earth physics, and machine-aided calculations. This great drying of land changes everything, so we are going to try.
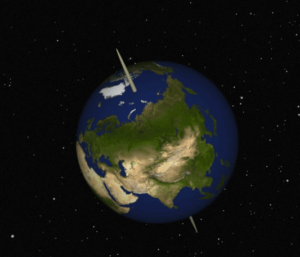
Dr. Samaniego begins with the tool that measures sea level changes based on wobbles in the Poles. Not like the magnetic Pole drifting eastwards in the Arctic, but the true Pole, the top of the axis for this spinning planet. Scientists have measured that for decades. We needed to know because the Poles are the fixed points for all GPS mapping, for everything that needs an exact location. They found the Poles move a little, because Earth wobbles. Adding more water to the oceans can affect the pull of gravity – by the Moon and even planets. That imperceptibly changes the shape of the Planet. No, we do not live on a nice tidy round globe. Earth’s shape changes. It gets blobby. Experts call it “the potato”.
That’s where we start, in the shifting shape of the potato, as rising heat sucks more water from world soils, dropping most of it into the ocean. That process can be measured by “polar motion”. This is a deep learning opportunity. Good luck.
Abrupt sea level rise reveals “permanent hydrological regime changes in the 21st century“. Earth’s land is steadily losing water to the sea. Soils are dryer as climate heats up. For a couple of years, terrestrial water loss added more to sea level than Greenland ice melt. Find all this in an important new paper led by Korean scientist Ki-Weon Seo.

Another hydrology expert, Dr. Luis Samaniego wrote a Perspective article about this for the journal Science. Luis is a top Hydrological Modeler with the Helmholtz Centre for Environmental Research, UFZ, at the University of Potsdam.
Listen to or download this 29 minute interview with Luis Samaniego in CD Quality or Lo-Fi
Contrary to what we think, this new study by Seo et al claims the largest driver of sea level rise is water transfer from the land to the ocean over the past several decades. We thought most sea level rise was coming from ice melt at the Poles and in the last mountain glaciers.
In 2014 I interviewed Dr. Jay Famiglietti about declining ground water under the big food-producing state of California. He told us how the twin Grace satellites measured small changes in gravity that indicate less water below. In 2018, Luis Samaniego told us southern Europe faced more drought, making Spain more desert-like within a lifetime.
This paper by Seo and colleagues is the best global water picture yet, and it is not encouraging. The title is: “Abrupt sea level rise and Earth’s gradual pole shift reveal permanent hydrological regime changes in the 21st century.”
According to this research, water loss after the year 2000 is worse than in the previous two decades. In between, from 2000 to 2002, there was a mass water loss event that is news to me. I thought “surely there must have been signs of this global water loss”. Yes: The droughts of 2001 and 2002 were some of the most severe in Canadian history. The Midwest and Rocky Mountain regions experienced severe drought in 2002, marked by dry conditions, wildfires, and water shortages. Southern California recorded its driest rain season since records began in 1877, But was this period of “great drying” in North America global? Now we know; the answer is “yes”.
POLAR MOTION
In addition to satellite measurements and sea level rise, the authors found a third factor that could prove or disprove their findings. This gets a little deep. We need to understand that Earth is not absolutely fixed in its shape. Adding more water here and less there can cause changes leading to wobbles in the location of the North Pole. And we are not talking about the drift of the magnetic pole. A tool that can reveal water loss is measuring “polar motion”.
When the Moon passes over land, very little of water within soils or sub-soils is moved by the gravity of the Moon. We all know that gravity pulls water toward it when passing over the ocean, leading to tides. So when relatively immobile water is transferred from the land to the sea, that makes the surface of Earth more flexible in the sense that seas are mobile. With more water in the ocean – whether from soil drying or ice melt at the Poles – Earth is more responsive to the gravity of the Moon. The change in location of mass also changes the wobble in the Northern Axis.
Why do we care about the location at the center or Earth’s spin? We need a constant place from which all other things are measured. You may be several miles or kilometers from a place, but that is all relative to something – the North or South polar axis. According to our guest Dr. Samaneigo, all Global Positioning Systems (GPS) rely on the location of that Pole. Many other things depend on it.
Over decades, scientists established the Pole does change positions. Several cycles from ten to more than a hundred years long became evident – like patterns in it’s travels. One of those is the Chandler cycle, or route of travel if you will. It shifts the rotational axis by about 3–9 meters (10–30 feet) over a period of about 433 days. But the Chandler wobble is becoming weaker since 2010.
With those known patterns more or less nailed down, it is possible for scientists to measure other small changes at the Pole. THOSE changes, out of known patterns, reflect changes in sea level. That can be tested. It works and that is one way to project the distribution and changes between land water and sea water.
This revealed the major change in water on Earth between the year 2000 and 2002. An extraordinary amount of water must have been drawn from the Earth, or melted from the Polar ice, to explain the wobble. Plus we have accurate sea level measurements for that period from both satellites and the Argo buoy measuring system. It all points to a large transfer of water from the soil to the sea.
There has been a continuous decline in soil moisture ever since – not as dramatic, but ongoing loss of land water. Maps included in the new paper by Seo et al show a few parts of the world consistently gained water over recent decades. Much larger areas lost a lot of water, including: central Africa, large parts of the Steppes in Central Asia, a very big area in China and Southeast Russia, the southern Amazon, and the American Southwest plus around the mid-West farming belt. Those drying regions include major areas of crops currently feeding the world.
As I understand it, global precipitation dropped significantly in the period 2000 to 2002 and remains below 1979 to 1999 levels. At the same time, the warming atmosphere has growing capacity (potential) to hold more water as vapor. With less rainfall, the disparity between water vapor in the atmosphere and the amount that could be there, increases. More poetically, could we say the air is becoming “thirstier”.
According to this study, from 1979 to 2016, about 10.78 mm – or almost half an inch of global mean sea level – came from just this land drying mechanism. That adds up to a serious problem. From the perspective of humans and land plants and animals, I guess the bigger concern is dwindling available water, rather than sea level rise. Although sea level rise will be catastrophically expensive – AND we did not know this major source of sea level rise, thinking it was all glaciers.
Although this paper is a break-through, checked with three sets of observations, the authors don’t claim the work is certain or complete. Now that a major threat of land water loss has been identified, we can hope for more funding to nail this down. Then… what can be done?
SIDEBAR
An Ocean Deep in the Earth?
There is a lot of water trapped in magma 400 miles beneath the Earth’s surface. It may be as much as the ocean.
New Evidence for Oceans of Water Deep in the Earth
Water bound in mantle rock alters our view of the Earth’s composition
June 13, 2014
That article is based on this 2014 paper “Dehydration melting at the top of the lower mantle”.
=====================
Please help support Radio Ecoshock with your donation. In tough times, the tough get going, with your help.
======================
HOW MUCH DO SHIPS HEAT THE PLANET?
DAVID KROODSMA
They are out there, unseen. At least 50,000 merchant ships bring you coffee, Crocs, everything. Tankers, container ships, freighters, cruise ships and fishing vessels – they burn heavy oil called “bunker fuel” and they churn out gigatons of greenhouse gases. How much? Nobody knows – until now.
David Kroodsma is Chief Scientist at the non-profit Global Fishing Watch. David has a Masters in Earth Systems and expertise in the global carbon cycle. He just released the study “Mapping industrial vessel emissions at sea”.
The new study found industrial vessels emitted 1.3 billion tons of CO2 in 2023. That is about 3% of global fossil fuel emissions. Maritime emissions grew by 20% between 2016 and 2023, outpacing global fossil fuel emissions.
Listen to or download this 13 minute interview with David Kroodsma in CD Quality

Ship owners don’t generally publish emissions. Some ship captains don’t want to be seen at all. David tells us about the “dark fleet” and challenges that posed to figuring out the real climate cost of ships at sea. This team observed a decrease in emissions from dark fleet vessels but a significant rise in emissions from vessels that do report to satellite AIS-tracking.
Actually, this technology is amazing. Using the mix of satellite data, and sophisticated software, these scientists can find every ship larger than 50 feet (15 meters) on the massive global ocean. They don’t have to wait long for results. I don’t think humans had this capability before. Maybe the military had it, who knows?
Don’t get this confused with cooling formerly provided by sulfates in ship emissions. This new report is about actual carbon dioxide and other greenhouse gases coming from the ship stacks as it burns fossil fuels. We didn’t have that number before, and neither did the Intergovernmental Panel on Climate Change when they assessed the future.
===============
CONFLICT => MORE CLIMATE HEATING
MANFRED LENZEN
Climate change may trigger wars. But the opposite is true and nobody is talking about it: conflict drives more climate change. The grand plans to avert climate disaster assume the economy and geopolitics of the present continue uninterrupted. None of that can be taken for granted now. A new study finds military activities amount to “approximately 5.5% of global emissions”. That is all off the books. Even without weapons, global conflict could sink hopes of reducing emissions to survivable levels.
A new study finds conflict damages climate action in at least seven ways. The title of the paper is: “Geopolitical conflict impedes climate change mitigation”. Anyone can read it and you should. We reached co-author Manfred Lenzen at the University of Sydney. Manfred has a PhD in Physics. He is a Professor of Sustainability Research with over 400 publications and many awards.

We live through new times of countries battling each other with economic hammers. People are divided, with protests in the streets in many parts of the world. It is a time of conflict, and it turns out, even that can further damage our climate. So this study is not just about wars, or even the military – although that is big. “Conflict” can include harmful competition between classes, ethnic groups or political parties.
Basically, my take is: when humans do not work together, they fall back to “easier” dirty technologies and harm to Earth and it’s species.
Listen to or download this 10 minute interview with Manfred Lenzen in CD Quality
COUNTING MILITARY EMISSIONS
Way back in 2010, I covered how militaries and wars add big-time emissions to push warming – with Canadian military analyst Gwynne Dyer. But this new paper “Geopolitical conflict impedes climate change mitigation” is different. Yes, we must count all those emissions from militaries operating all over this planet. They are major polluters. That endangers the present and the future. But even the stress you feel today can slow action we need to save ourselves and our descendants. Alliances are breaking down into diplomatic stalemates and pointless trade wars. Global organizations and agreements are tanking. But we need those human connections to deal with a global threat of our own making, to stave off the worst of climate change.
It was refreshing to finally find military emissions in this report: “For instance, a B-2 stealth bomber emits around 1t[on] of CO2 per 45 kilometers of flight, while a destroyer ship emits about 9t of CO2 per hour. “ What we don’t see on TV: every missile fired and every space launch adds more tons of greenhouse gases to the atmosphere. I think every national force needs a plan to reduce greenhouse gases.
They find that military activities amount to “approximately 5.5% of global emissions”.
NATO countries are frantically spending more on military. Denmark will conscript women and Poland plans to reinstate mandatory military service. But the world can’t find enough money to help developing countries hit hard by our emissions. Manfred talks to us about diversion of funds.
QUICK LIST OF FACTORS pathways hampering mitigation
reduced political cooperation,
shifting trade relations,
increased self-sufficiency,
diversion of funds,
military vehicle emissions and
asset destruction
The climate crisis has almost disappeared from mainstream American media, with Donald Trump soaking up all the media oxygen. Meanwhile weather has gone wild in the U.S. It’s not just America. This team found “between November 2021 and March 2022, the daily mentions of climate change in Russian media fell from 1400 to less than 300.”
The new paper in npj Climate Action argues that…
“disruptions to global cooperation are not only possible, but inevitable.”
Can we save a livable climate without global cooperation? Can national or regional action be enough?
THE ROCKY ROAD SCENARIO
The bare bones of this was mentioned in IPCC literature as the “Rocky Road” scenario:
…Shared Socio-Economic Pathway (SSP) 3, which represents the worst case of projected SSPs in AR6, a conflict-prone geo-political situation is vaguely defined as a “Rocky Road”18: “A resurgent nationalism, concerns about competitiveness and security, and regional conflicts push countries to increasingly focus on domestic or, at most, regional issues. Policies shift over time to become increasingly oriented toward national and regional security issues. […] A low international priority for addressing environmental concerns leads to strong environmental degradation in some regions.”
I picture short periods, maybe a few years, when climate demand and action are synced up enough to make progress. Maybe that is followed by a few years of backsliding. This suggests a need for stringent, maybe revolutionary emissions reductions, when those are possible. If conflicts are inevitable, and they slow down climate solutions, that could mean our path to a low-emissions civilization will take much longer. The trouble is: time is not on our side when it comes to atmospheric heating.
The study authors conclude: “Therefore, the speed of planned mitigation may need to be even faster than reflected in today’s mitigation targets, because we need to consider that global conflicts cause significant disruptions that will lead to delays in the transition to net zero.”
This study finally voices concerns I’ve had for years. The grand plans to avert climate disaster – from governments or IPCC – generally assume continuation of present norms and geopolitics. We see now: none of that can be taken for granted.
THE WAR IN UKRAINE HAS MORE EMISSIONS THAN AUSTRIA OR HUNGARY…
The study says: “Total emissions caused by the Russia-Ukraine war over its first two years have been estimated at 175 Mt CO2-e, with most of this (57%) fitting into the asset destruction category, and increased by 30% in its third year, reaching 230 MtCO2e – equivalent to the annual emissions of Austria, Hungary, the Czech Republic, and Slovakia combined.”
Alex thinks: a war is like adding more industrial polluting countries to the world map!
A VICIOUS CIRCLE
From the study: “Were the reality of the debated Climate=>Conflict-nexus validated, and combined with the evidence presented here, a worrying realisation would emerge: In that case, the opposing nexus directions (see Fig. 1) could indeed form a vicious cycle, in which climate change leads to conflict that in turn undermines mitigation, leading to additional climate change, and so on.”
To be honest, my short time with Manfred Lenzen didn’t fully capture this key new understanding. There is a barrier we did not see – not in physics but in human social knowledge. Some scientific papers are difficult to read or hidden behind paywalls. This one is meant for all of us, and it is free. Get it here.
So, boys and girls, here we are at the precipice of something. Our world is wobbling. You need time to breathe, to exercise, to love one another. You also need time to feed your brain beyond tidal wave of today’s scary news. I hope you will tune in again next week, as we report from the outer world, from reality where the big game goes on.
I’m Alex. Thank you for listening, and caring no matter what.
Dr Samaniego’s detailed explanation of decadal changes in Earth hydrology – identified by the latest science methodology – is interesting. We naturally expect the warmer global surface area to increase water vapor, but perhaps surprising is that a higher percentage of the resulting precipitation is now falling over oceans, & correspondingly less over land areas. Thus the net result is a drying out of the lithosphere, which is perhaps another self-reinforcing feedback?
If we accept the accuracy of this scientific analysis then it suggests all nations should now be taking steps to retain more of the precipitation that does fall. Shading of streams & waterways might be an important factor in achieving this because, surprising to me, running water evaporates faster than still water, especially during hot weather.
Apparently the movement of water increases the rate of evaporation due to the constant refreshing of the air at the water’s surface and the slight warming of the water molecules through friction (which is increased by wind) according to UCSB Science Line.